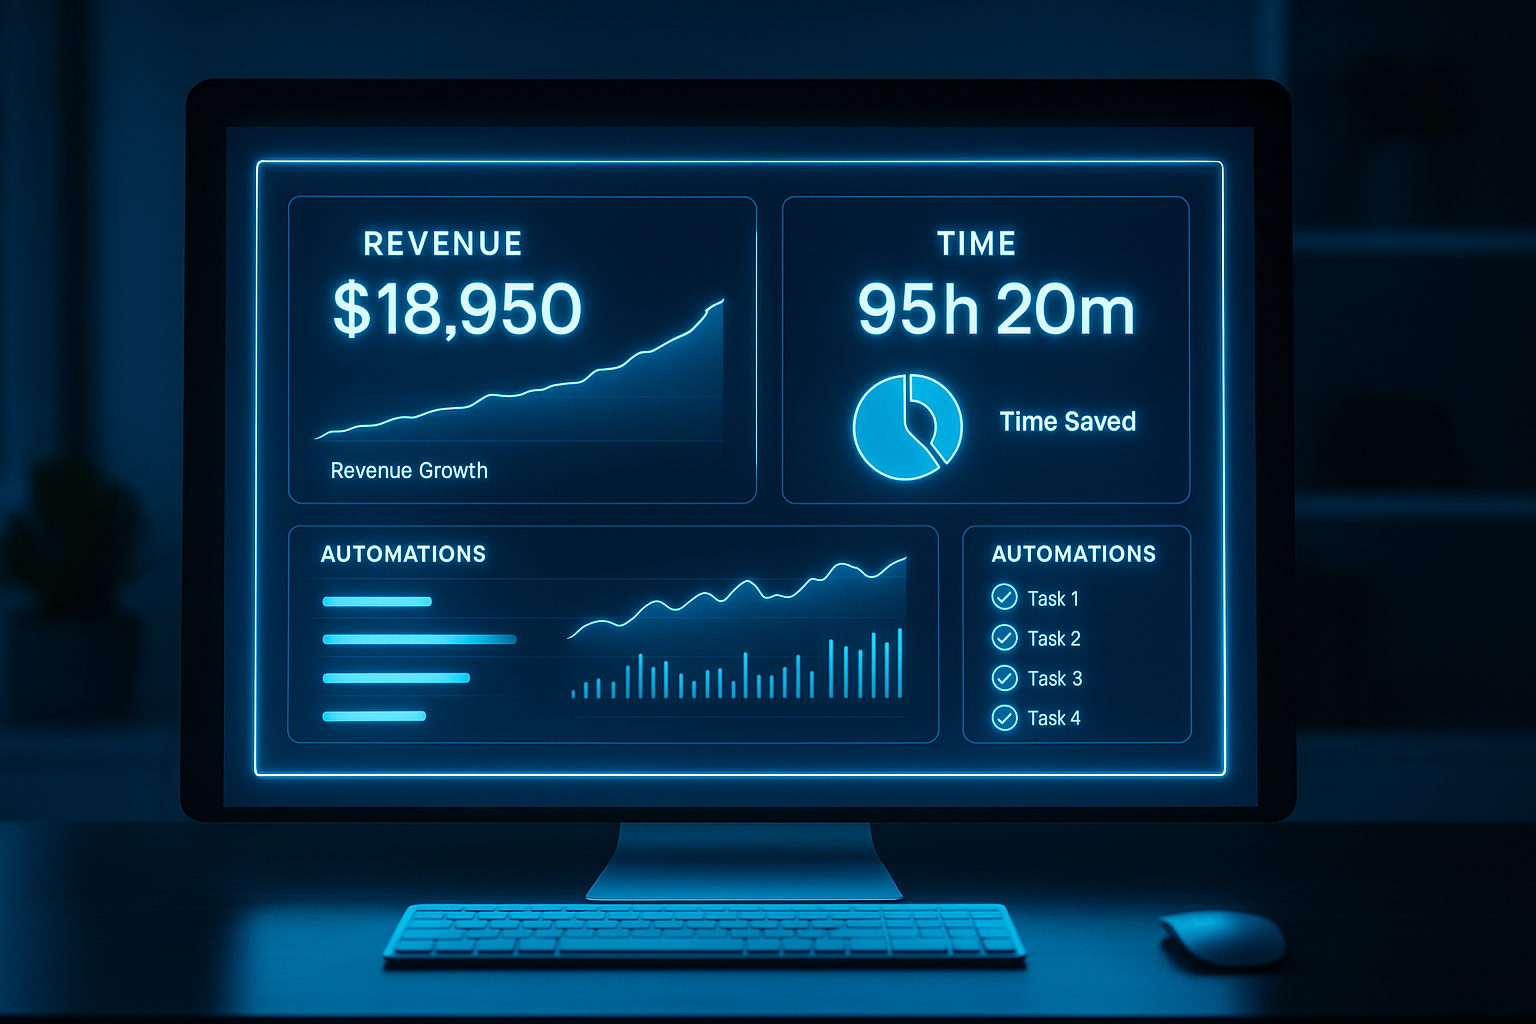
What Dashboard Should I Be Looking At Weekly?
Cut the Fluff, Keep the Focus

Too many business owners think dashboards are for big corporations. The truth? A simple weekly dashboard can make or break your momentum. You don’t need a thousand data points. You need the right ones—updated weekly, not annually. This post walks you through the exact metrics to track every single week so you can:
- Make fast, smart decisions
- Catch problems before they snowball
- Focus your time where it counts
The Problem: Too Much Data, Not Enough Direction
A typical small business owner is drowning in data:
- Google Analytics
- CRM notifications
- Accounting tools
- Manual spreadsheets
But what actually matters every week? Let’s simplify.
The Weekly Dashboard: What to Include
Here are the only five sections your weekly dashboard needs:
1. Lead Flow
- How many new leads this week?
- Where did they come from?
- Which source converted best?
Check out The Efficiency Blueprint to learn how systematized lead tracking supports smarter marketing decisions.
2. Sales Pipeline
- Total number of leads in pipeline
- How many are in each stage?
- How many are moving forward?
This helps you predict cash flow and follow up effectively.
3. Revenue Overview
- New revenue this week
- Outstanding invoices
- Weekly trend (vs. goal)
If cash flow surprises you, you’re not tracking it closely enough.
4. Client Fulfillment
- How many projects/jobs/tasks were completed?
- Any delays or missed handoffs?
- Team capacity or burnout indicators?
This keeps you honest about delivery quality as you grow.
5. Operational Efficiency
- Tasks completed vs. assigned
- Open tasks or bottlenecks
- Automation vs. manual input ratio
Check out How Automation Boosts Profitability to learn the efficiency side of tracking.
Tools That Make It Easy
No need to reinvent the wheel. Use:
- GoHighLevel: CRM + automation + reporting
- Google Data Studio: Clean, custom dashboards
- ClickUp or Notion: Task completion + capacity
- QuickBooks or Wave: Finance snapshots
The key is integrating them where possible—so you don’t have to click 10 tabs.
Real Example: How Monday.com Improved Their Team Visibility
Monday.com scaled fast—but without metrics clarity, departments were siloed.
They used their own platform to:
- Build visual dashboards tracking team output
- Monitor lead quality by source
- Set up alerts when workflows stalled
The result? Increased cross-team collaboration and 40% faster project delivery.
Source: Monday.com Case Study Library, 2022
Final Takeaway
You don’t need more dashboards. You need the right one.
A weekly dashboard gives you:
- Confidence in your numbers
- Control over your growth
- Clarity on what’s working (and what’s not)
You can’t optimize what you’re not tracking. And what you track? You can scale.
Next Steps
Need help building a weekly dashboard you’ll actually use? Schedule a Business Audit with The Omnia Co. We’ll help you decide what to track, where to track it, and how to use it to grow smarter—not harder.
More Marketing Tips, Tricks & Tools


